Which of the following relationships represents a no correlation between two variables?
As a student’s class attendance decreases, the student’s overall grade remains the same
As the number of hours a person exercises decreases, the weight of that person increases
As the number of miles driven increases, the amount of the gasoline in the tank decreases
As the amount of water plant receives increases, the growth rate of the plant increase.
Correct Answer : A
Correlation of two variables falls into:
Positive correlation: an increase in one variable causes another variable to increase
Negative correlation: an increase in one variable causes another one to decrease
No correlation: a change in one variable does not cause any response in another variable.
From the given choices
Option a is no correlation
Option b is a negative correlation
Option c is a negative correlation
Option d is a positive correlation
Thus, the correct statement is a.
TEAS 7 Exam Quiz Bank
HESI A2 Exam Quiz Bank
Find More Questions 📚
Teas 7 Questions: We got the latest updated TEAS 7 questions
100% Money Refund: 100% money back guarantee if you take our full
assessment pass with 80% and fail the actual exam.
Live Tutoring: Fully customized live tutoring lessons.
Guaranteed A Grade: All students who use our services pass with 90%
guarantee.
Related Questions
Correct Answer is A
Explanation
The length of the unknown side of the rectangle can be found by using the Pythagoras theorem. Letting the unknown side to be x, the labelled rectangle becomes: The unknown length of the triangle is about 16.7 feet.
The length of the unknown side of the rectangle can be found by using the Pythagoras theorem. Letting the unknown side to be x, the labelled rectangle becomes: 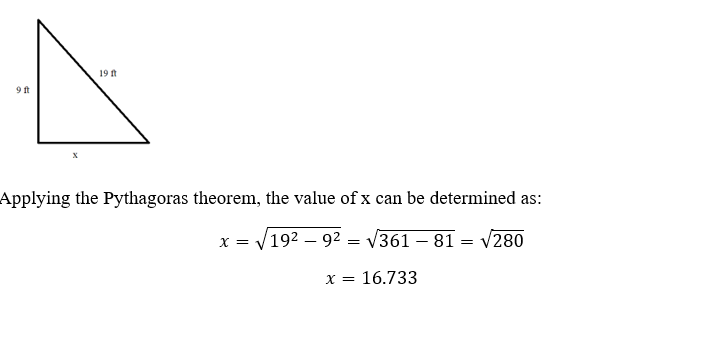
The unknown length of the triangle is about 16.7 feet.
Correct Answer is D
Explanation
The net income is the salary of the teacher gets after deducting total taxes.
Weekly net income=weekly gross income-total tax
Total tax=federal income tax+state income tax+Social Security tax
Total tax=$(72.00+35.00+65.00)
Total tax=$172.00
Weekly net income=$(730.00-172.00)=$558.00
The net income the teacher gets in 4 weeks is what she gets in one week multiplied by 4
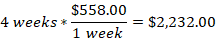
The teacher will earn a net income of $2,232.00 in 4 weeks after taxes are deducted.
Correct Answer is A
Explanation
: In order to solve for the value of x, we use the order of operations as follows:
The first step is to divide both sides by 3


Add 2 to both sides to eliminate it from the left-hand side of the equation
x-2+2=4+2
x = 6
Thus, the value of x is 6.
Correct Answer is C
Explanation
The distribution of the weights of the newborn babies is symmetric meaning the mean, mode, and median are all equal. Thus, the bell-shape curve describes this kind of distribution of weights
Correct Answer is D
Explanation
From the given estimations, we can find the exact sum after adding the given numbers and see the trend the student utilizes to find their estimates. The actual sum is as follows
26+180= 206
206
115+391= 506
506
497+2024= 2521
2521
From the above evaluation, the students round the exact sum to the nearest tens. So, in the problem we need to approximate 545+7501.
545+7501=8046
The exact sum is 8046 and the approximate value after rounding to the nearest tens is 8050.
Correct Answer is D
Explanation
: the question requires we find the cost of four syringes.
If we let x be the cost of four syringes, then we set up a proportion equation with cost as numerator and number of syringes as denominator. The proportion equation becomes

Cross-multiply to solve for x
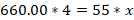

Rearranging the above

Divide both sides of the equation by 55


Thus, the cost of 4 syringes is $48.
Correct Answer is D
Explanation
When solving percent problems, the following words and their meaning becomes handy.
- Is means equals
- Of means multiply
- What means unknown (variable)
If we let x represent the amount of tip the couple want to leave behind, then
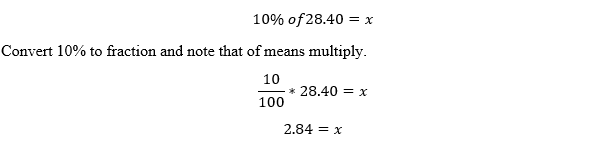
So, the couple will leave a tip of $2.84, which is about $3.00
Correct Answer is C
Explanation
from the given data, one gallon of cleaning solution requires 6 oz of ammonia. The mathematical expression of this statement can be expressed in two ways:
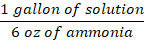
Or
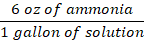
The question requires we find the amount of ammonia needed to make 230 gallons of the solution. So, we use the second option and proceed as follows:

From the above equation, gallon of solution will cancel, and oz of ammonia is left.
Therefore, the solution will require 1380 oz of ammonia.
Correct Answer is C
Explanation
We asked to convert kg to pounds. There are two ways of converting between kg and pounds

And

Since we are to find pounds, we use the second option for kg to cancel
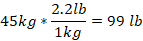
The pound equivalent of 45 kg is 99 lb.
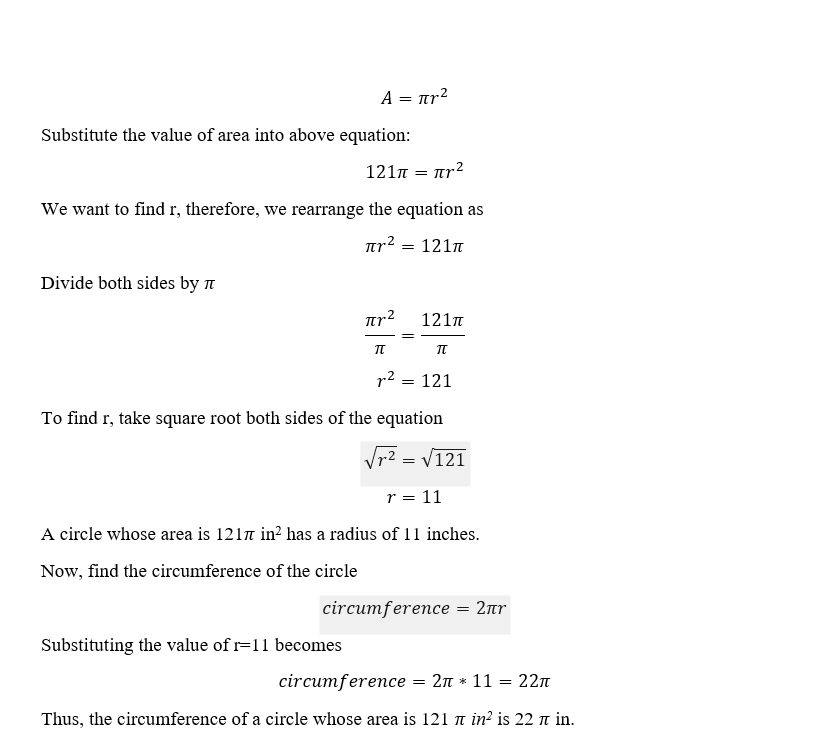
Correct Answer is B
Explanation
To solve this problem, first find the radius of the circle.
This question was extracted from the actual TEAS Exam. Ace your TEAS exam with the actual TEAS 7 questions, Start your journey with us today
Visit Naxlex, the Most Trusted TEAS TEST Platform With Guaranteed Pass of 90%.
Money back guarantee if you use our service and fail the actual exam. Option of personalised live tutor on your area of weakness.