Which of the following percentages is equivalent to the fraction below?
5/8
1.6%
6.25%
62.5%
160%
Correct Answer : C
to convert fraction to percent, we multiply the fraction with 100. Therefore, the percent equivalent of 5/8 is
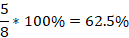
Thus, 5/8 is equal to 62.5%.
TEAS 7 Exam Quiz Bank
HESI A2 Exam Quiz Bank
Find More Questions 📚
Teas 7 Questions: We got the latest updated TEAS 7 questions
100% Money Refund: 100% money back guarantee if you take our full
assessment pass with 80% and fail the actual exam.
Live Tutoring: Fully customized live tutoring lessons.
Guaranteed A Grade: All students who use our services pass with 90%
guarantee.
Related Questions
Correct Answer is A
Explanation
We use 1 L =1000 mL to convert between the two units. The conversion fractions of interconverting are:

And

Since we want to end up with millimeters, the second conversion is used in converting L to mL as:
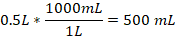
Thus, 0.5 L is equivalent to 500 mL.
Correct Answer is B
Explanation
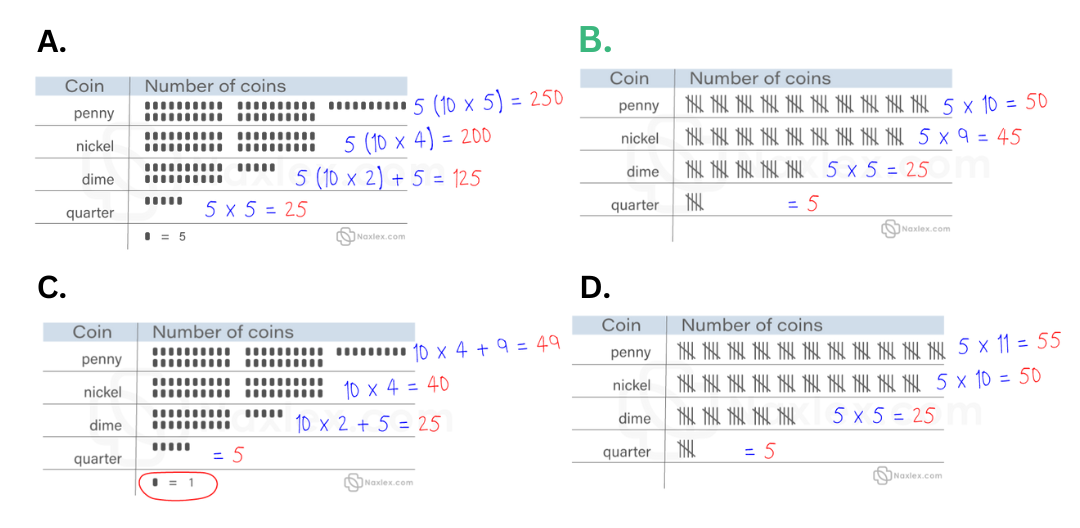
In this scenario, we use the given scale in the charts to find the number of each coin and selected the right number of coins the student collected. The second options shows that the child collected 50 pennies, 45 nickels, 25 dimes, and 5 quarters.
Correct Answer is D
Explanation
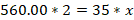
In order to solve for the value of x, we use the order of operations as follows:
The first step is to divide both sides by 4


Since 5 is subtracted, we add 5 to both sides to eliminate it from the left-hand side of the equation
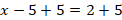

Thus, the value of x is 7.
Correct Answer is C
Explanation
the question requires we find the cost of two syringes.
If we let x be the cost of two syringes, then we set up a proportion equation with cost as numerator and number of syringes as denominator. The proportion equation becomes

Cross-multiply to solve for x

Rearranging the above

Divide both sides by 35


The cost of 2 syringes is $32.
Correct Answer is B
Explanation
Since the distribution is symmetric, the mean, mode, and median will all be equal. The shape of the distribution will be bell-shaped.
Correct Answer is C
Explanation
to convert fraction to percent, we multiply the fraction with 100. Therefore, the percent equivalent of 5/8 is
Thus, 5/8 is equal to 62.5%.
Correct Answer is A
Explanation
Based on the above data, the horizontal axis will be tree type and vertical axis will represent the number of trees.
Based on these, a bar graph is appropriate to represent the number trees.
Correct Answer is C
Explanation
to find the average time the athlete runs in 1 mile, find total time divided by total distance covered.
Total distance=4+4=8 miles
Total time=28+32 =60 minutes
From the above, the athlete runs 8 miles in 60 minutes, so the athlete will take how minutes to cover 1 mile.
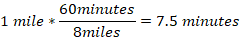
So, the athlete covers 1 mile in 7.5 minutes.
Correct Answer is D
Explanation
The first three months of the year are January, February, and March. We need to find the total rainfall for these three months from the provided graph.
In the month of January, rainfall is between o and 1, which is halfway. Therefore, rainfall in January is 0.5 inches
On February, rainfall was 1 inch and on March the rainfall was 2 inches. Thus,
Total rainfall = 0.5 inches + 1 inches + 2 inches = 3.5 inches
Correct Answer is D
Explanation
we use given information to find how much ammonia is need to make the specified solution.
We are told, one gallon of cleaning solution requires 6 oz of ammonia. In other words, we can express this as:
1 gallon of solution6 oz of ammonia
Or
6 oz of ammonia1 gallon of solution
Since we are needed to find how much ammonia is needed, we use the second option to find how much ammonia is required by 120 gallons of solution.

From the above equation, gallon of solution will cancel, and oz of ammonia is left.
Therefore, the solution will require 720 oz of ammonia.
This question was extracted from the actual TEAS Exam. Ace your TEAS exam with the actual TEAS 7 questions, Start your journey with us today
Visit Naxlex, the Most Trusted TEAS TEST Platform With Guaranteed Pass of 90%.
Money back guarantee if you use our service and fail the actual exam. Option of personalised live tutor on your area of weakness.