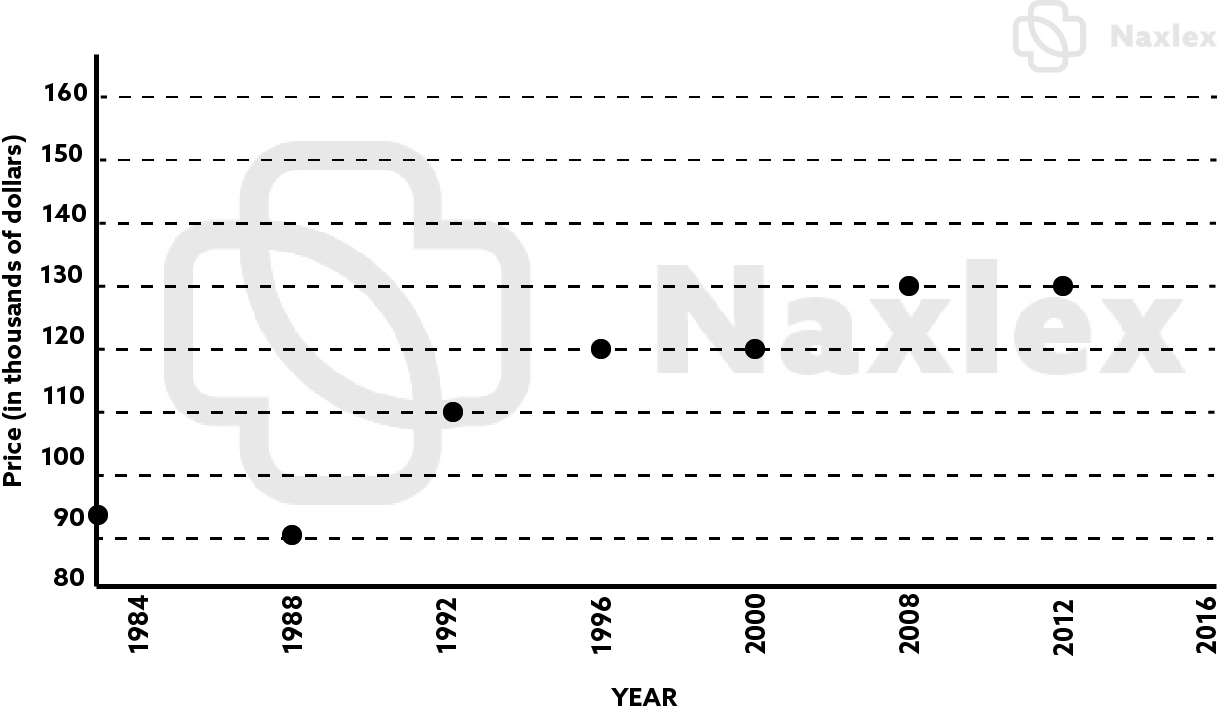
If the trend below continues, which of the following is the best estimate of the average price of a home in 2016?
$155,000
$120,000
$125,000
$140,000
Correct Answer : D
Looking at the given trend, it is observed that the price increases with years. From 2008 to 2012, the price is fairly constant but we expect it to be more than $130,000 in the year 2016. The expected price in 2016 is $140,000.
TEAS 7 Exam Quiz Bank
HESI A2 Exam Quiz Bank
Find More Questions 📚
Teas 7 Questions: We got the latest updated TEAS 7 questions
100% Money Refund: 100% money back guarantee if you take our full
assessment pass with 80% and fail the actual exam.
Live Tutoring: Fully customized live tutoring lessons.
Guaranteed A Grade: All students who use our services pass with 90%
guarantee.
Related Questions
Correct Answer is B
Explanation
In the simple interest, we utilize the following formula to find the simple interest after a period of time in years.
I=P*r*t
I is the interest
P=Principal or initial deposit
r=rate
t=time in years
From the given problem, P=$600, r=6%=6/100=0.06, t=5 years. Then
I=$600*0.06*5=$180
After 5 years, Pat will earn an interest of $180.
Correct Answer is A
Explanation
to do a comparison of the given data set, we convert the fraction numbers into the approximate decimals.
4/3=1.333
2720=1.35
Now, we have 1.333, 1.35, 1.369, 1.357. These numbers are arranged from the smallest to the largest number, we look at the number in the second decimal place value
1.333 the number in second decimal place value is 3
1.35 the number in third decimal place value is 5
1.369 the number in third decimal place value is 6
1.357 the number in third decimal place value is 5
However, 1.35 and 1.357 have 5 in the second-place vale. We use the ird place value to compare the two number:
1.35 is same as 1.350 and the number in the third-place value is 0
1.357 the number in the third-place value is 7
Now, 0 is less than 7, and thus 1.35 is less than 1.357
Overall, 3 is less than 5, and 5 less than 6 and the provided numbers can be arranged from the smallest to the largest as:
1.333, 1.35, 1.357, 1.369
Thus, the corresponding given numbers organized from the smallest to the largest become:
4/3, 27/20, 1.357, 1.369
The greatest value is 1.369
Correct Answer is A
Explanation
all products represent 100%. Then, the portion of defect products is:
0.0025 of 100%
‘of’ means multiply
0.0025 *100%=0.25%
Correct Answer is B
Explanation
The median temperature can be found by organizing the temperature values from the smallest to the largest value as follows:
98.6, 98.7, 99.0, 99.0,99.2, 99.3, 99.7, 100.0
(for an even set of numbers, Median = frac{(frac{n}{2})th observation + (frac{n}{2} + 1) th observation}{2})
From the data set above, there are 8temperature values. The median is the temperature value in the middle position, which falls between the(frac{n}{2} th)and((frac{n}{2} + 1) th) position. Here N=8and median is found as:
(frac{(frac{n}{2})th + (frac{n}{2} + 1) th}{2} = )(frac{(frac{8}{2})th + (frac{8}{2} + 1) th }{2} = 4.5th position)
The element in the 4.5th position is the average of the 4th and 5th element.
(frac{99.0 + 99.2}{2} = 99.1)
Thus 99.1 is the median temperature.
Correct Answer is D
Explanation
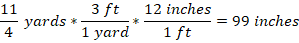
we use the US customary system of units’ equivalent to convert from yards to inches. We know that 1yard=3 ft, and 1 ft =12 inches.
First, convert 2 ¾ into an improper fraction.
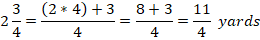
Then,
Correct Answer is A
Explanation
We are given a mix of fractions and decimals and to compare the numbers, we convert the given decimals to fractions.
4.4 becomes 44/10
4.25 becomes 425/100
Now the set of fractions for comparison are: 9/2, 10/3, 44/10, and 425/100. The least common denominator for 2, 3 and 10 is 300. Then,
9/2*300=1350
10/3*300=1000
44/10*300=1320
425/10*300=1275
From the above products, 9/2 gives the greatest value when the fractions are compared with the least common denominator of the given denominators.
Correct Answer is D
Explanation
Percentages always add up to 100%. If we let x be the percent of graduates working for jobs unrelated to law, then
74%+3%+2%+x=100%
79%+x=100%
Subtract 79% from both sides of the equation
79%-79%+x=100%
x=100%-79%
x=21%
So, the number of graduates working for jobs unrelated to law is 21%.
Correct Answer is A
Explanation
From the given problem,
49.5 pounds of fertilizer is needed to farm 1 acre of land. This can be interpreted as:

Or

Now we are needed to find the acres of land that will be farmed using 2000 pounds of fertilizers. To solve this, we use the second option as follows:
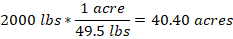
2000 pounds of fertilizers can farm approximately 40 acres of land.
Correct Answer is D
Explanation
Looking at the given trend, it is observed that the price increases with years. From 2008 to 2012, the price is fairly constant but we expect it to be more than $130,000 in the year 2016. The expected price in 2016 is $140,000.
Correct Answer is D
Explanation
Here, the athlete runs 6 miles in 51 minutes, which can be expressed as:

Now, in 90 minutes, the athlete will cover about
Therefore, the athlete runs about 10.6 miles in 90 minutes.
This question was extracted from the actual TEAS Exam. Ace your TEAS exam with the actual TEAS 7 questions, Start your journey with us today
Visit Naxlex, the Most Trusted TEAS TEST Platform With Guaranteed Pass of 90%.
Money back guarantee if you use our service and fail the actual exam. Option of personalised live tutor on your area of weakness.