Which of the following is the best description for the data set below?
1, 1, 2, 2, 2, 2, 3, 3, 7, 7, 8, 8, 8, 8, 9, 9
Uniform
Right-skewed
Bimodal
Left-skewed
Correct Answer : C
To solve this problem, we need to find the mean, mode, and median of the above data set.
From the data set, the mode of the data is 2 and 8. They are the most occurring elements in the data set.
The mean of data is the total divided by the number of elements
Total=1+ 1 + 2+ 2+ 2+ 2+ 3 +3+ 7+ 7+8+8+ 8+ 8+ 9+9=80
Number of elements=16
Mean=80/16=5
Median will fall in between the (N/2)th and (N/2+1)th position
(N/2)th =16/2 =8th position and (16/2+1)th =9th position
Since the data is arranged in ascending order as below
1, 1, 2, 2, 2, 2, 3, 3, 7, 7, 8, 8, 8, 8, 9, 9
Element in 8th position = 3
Element in 9th position =7
So the median average of the two elements=(3+7)/2=5
Now the data could be presented as follows in the distribution curve
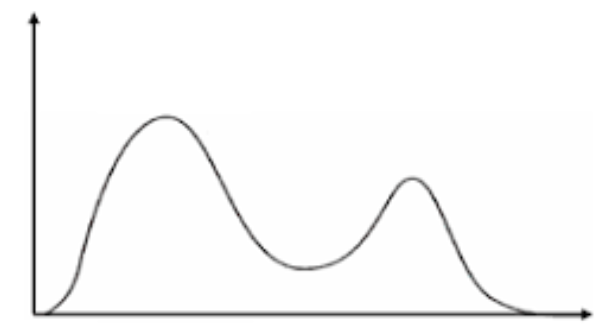
This is because the data set has two modes, meaning the data is bimodal.
TEAS 7 Exam Quiz Bank
HESI A2 Exam Quiz Bank
Find More Questions 📚
Teas 7 Questions: We got the latest updated TEAS 7 questions
100% Money Refund: 100% money back guarantee if you take our full
assessment pass with 80% and fail the actual exam.
Live Tutoring: Fully customized live tutoring lessons.
Guaranteed A Grade: All students who use our services pass with 90%
guarantee.
Related Questions
Correct Answer is C
Explanation
From the given equation, the variable t is varied to obtain the value of f(t). This means that t is an independent variable, modified variable while f(t) is a dependent variable, a measured value.
Correct Answer is B
Explanation
We use the relation 1 kg=1000 g to convert 3.193 kg to g

Correct Answer is C
Explanation
Use the relation 1 teaspoon=4.93 mL to change 2.5 teaspoons to mL. Using the dimension analysis, the amount in mL is found as:

Correct Answer is C
Explanation
The best way to display the frequency of each day of the week when students get up after 8 a.m. is by using a bar graph. Bar graphs are well-suited for representing categorical data, where each day of the week is a separate category, and the height of each bar corresponds to the count or frequency of students waking up late on that specific day.
Note: Histograms, on the other hand, are more appropriate for visualizing continuous or numerical data and are not ideal for categorical data like days of the week.Histograms are useful for understanding the distribution of data, identifying patterns, and assessing the shape of the data distribution, such as whether it's normally distributed, skewed, or has multiple modes.
As you can see below, the Histogram is used to depict a pattern/continuous/rangedata. While a bar graph does just fine even with discrete data.


Correct Answer is B
Explanation
To convert inches to centimeters, use the conversion factor:
1inch=2.54cm
Now, multiply:
7×2.54=17.78cm
Correct Answer is A
Explanation
To find a solution to this, we need to find the change in spending between the year 2013 and 2015 for each country. Change is difference in amount spent in 2015 and 2013 for each country:
Sudan=$(24-17)= $7
Eritrea=$(42-56)= - $14
Nigeria = $(21-16)= $5
Tanzania =$(81-68) = $13
Rwanda = $(24-27) =-$3
Kenya = $(88-81) = $8
A Minus sign means a decrease in spending. From the above calculations, Eritrea had the GREATEST change in dollars spent while Rwanda had the LEAST change in dollars spent.
Correct Answer is A
Explanation
The dimension of the field is shown below.

Area of rectangle = length * width
Area of rectangle = 100 m *75 m = 7500 m2
Area of the rectangle in hectares =
Correct Answer is A
Explanation
Let two numbers be x and y. Then
Three time a number=3x
Eight times a different number = 8y
Sum of the two is 3x+8y
Correct Answer is B
Explanation
100% represents total students four allied health program. Thus, 100%=800 students, and 19% joins respiratory care program is

Thus, 152 students joined the respiratory care program.
Correct Answer is D
Explanation
The most likely weight of pencil is 25 g, because a pencil is a lighter object which is measured in grams.
This question was extracted from the actual TEAS Exam. Ace your TEAS exam with the actual TEAS 7 questions, Start your journey with us today
Visit Naxlex, the Most Trusted TEAS TEST Platform With Guaranteed Pass of 90%.
Money back guarantee if you use our service and fail the actual exam. Option of personalised live tutor on your area of weakness.