The table below shows the student’s score at the end of the semester. Which of the following would best display the data?
|
Subject |
Math |
Chemistry |
Biology |
Physics |
English |
|
Test scores |
90 |
72 |
85 |
95 |
63 |
Stem and leaf plot
Line graph
Bar graph
Scatter plot
Correct Answer : C
The best way to visualize the student’s score for each subject is to plot them using a bar graph.
TEAS 7 Exam Quiz Bank
HESI A2 Exam Quiz Bank
Find More Questions 📚
Teas 7 Questions: We got the latest updated TEAS 7 questions
100% Money Refund: 100% money back guarantee if you take our full
assessment pass with 80% and fail the actual exam.
Live Tutoring: Fully customized live tutoring lessons.
Guaranteed A Grade: All students who use our services pass with 90%
guarantee.
Related Questions
Correct Answer is A
Explanation
We convert the given word problem into a mathematical expression.
Let the number be x.
Thrice a number = 3x
Twelve less than thrice a number = 3x-12
Thus, the required mathematical expression is 3x-12
Correct Answer is D
Explanation
to convert fraction to percent, multiply the fraction with 100%. Therefore, the percent equivalent of 3/4 is
3/4*100%=75%
Thus, 3/4is equal to 75%.
Correct Answer is D
Explanation
We need to find how many mL are in 5.5 teaspoons. We are told that 1 teaspoon is about 4.93 mL, which we interpret as follows:

Or

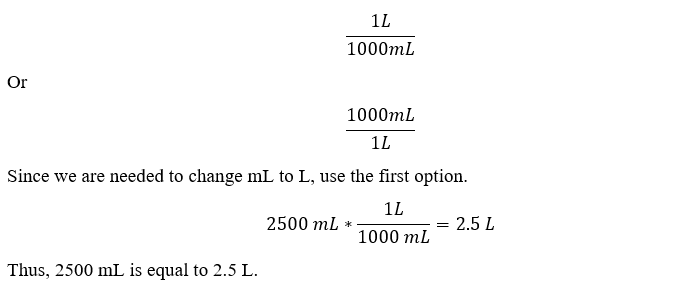
Since we are looking for mL, we use the second option.
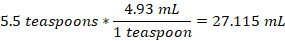
Thus, 5.5 teaspoons can hold approximately 27 mL.
Correct Answer is B
Explanation
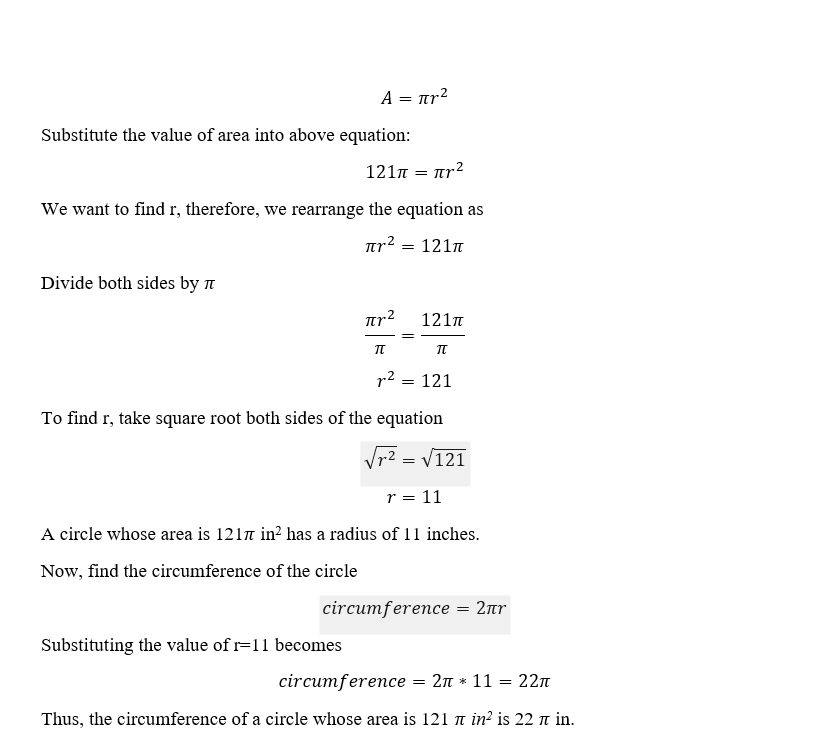
To solve this problem, first find the radius of the circle.
Correct Answer is D
Explanation
Looking at the give curve, we analyze each statement as:
- For statement 1: the points per game decreased five times between 1996 and 2015. So, the statement is false.
- For statement 2: the lowest points scored per game was in 1998-99 season and not in 2003-04 season. So, the statement is false.
- For statement 3: 2008-09 was the season the chargers scored the greatest number of points per game. So, this statement is false.
- For statement 4: the two season which no change in the points were 2012-13 and 2013-14. So this is true according to given curve.
Correct Answer is A
Explanation
The length of the unknown side of the rectangle can be found by using the Pythagoras theorem. Letting the unknown side to be x, the labelled rectangle becomes: The unknown length of the triangle is about 16.7 feet.
The length of the unknown side of the rectangle can be found by using the Pythagoras theorem. Letting the unknown side to be x, the labelled rectangle becomes: 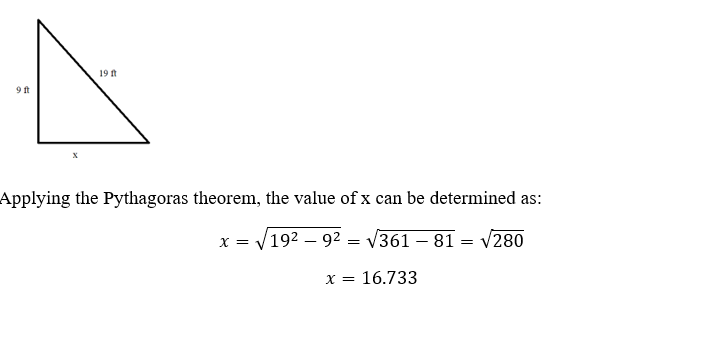
The unknown length of the triangle is about 16.7 feet.
Correct Answer is C
Explanation
Explanation: We know that 1 L=1000 mL and to change between L and mL we use the following two options

Correct Answer is D
Explanation
The interconversion of yards to feet utilizes the relationship 1 yard =3 feet. Then, 9 yards to ft becomes
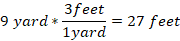 t
t
There, 9 yards is equal to 27 ft.
Correct Answer is D
Explanation
: we are needed to find the portion of burger the two other friends share between themselves. A whole burger is 1, and we know that,
One friend=1/4 of 1=1/4*1=1/4
Remaining amount=1-1/4=4/4-1/4=3/4
Thus, ¾ of burger is left for two friends to share among themselves. Then, each friend will get
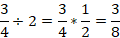
So, the other two friends will each get 3/8 of the burger.
Correct Answer is D
Explanation
: the question requires we find the cost of four syringes.
If we let x be the cost of four syringes, then we set up a proportion equation with cost as numerator and number of syringes as denominator. The proportion equation becomes

Cross-multiply to solve for x
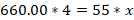

Rearranging the above

Divide both sides of the equation by 55


Thus, the cost of 4 syringes is $48.
This question was extracted from the actual TEAS Exam. Ace your TEAS exam with the actual TEAS 7 questions, Start your journey with us today
Visit Naxlex, the Most Trusted TEAS TEST Platform With Guaranteed Pass of 90%.
Money back guarantee if you use our service and fail the actual exam. Option of personalised live tutor on your area of weakness.