A sweater that normally sells for $78 is marked 15% off. Which of the following estimates the sale price of the sweater?
$12
$66
$22
$69
Correct Answer : B
we are to find the selling price of the sweater from the marked price and the discount. The marked price is given as
Discount=mark off rate*original price
Discount=15%*$78
Convert 15% into a fraction, which become 15/100=0.15. Then
Discount=0.15*$78=$11.70
The selling price of the sweater will be the original price less the discount or mark off value. Then,

Thus, the approximate selling price of the sweater is $66.
TEAS 7 Exam Quiz Bank
HESI A2 Exam Quiz Bank
Find More Questions 📚
Teas 7 Questions: We got the latest updated TEAS 7 questions
100% Money Refund: 100% money back guarantee if you take our full
assessment pass with 80% and fail the actual exam.
Live Tutoring: Fully customized live tutoring lessons.
Guaranteed A Grade: All students who use our services pass with 90%
guarantee.
Related Questions
Correct Answer is D
Explanation
: the question requires we find the cost of four syringes.
If we let x be the cost of four syringes, then we set up a proportion equation with cost as numerator and number of syringes as denominator. The proportion equation becomes

Cross-multiply to solve for x
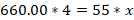

Rearranging the above

Divide both sides of the equation by 55


Thus, the cost of 4 syringes is $48.
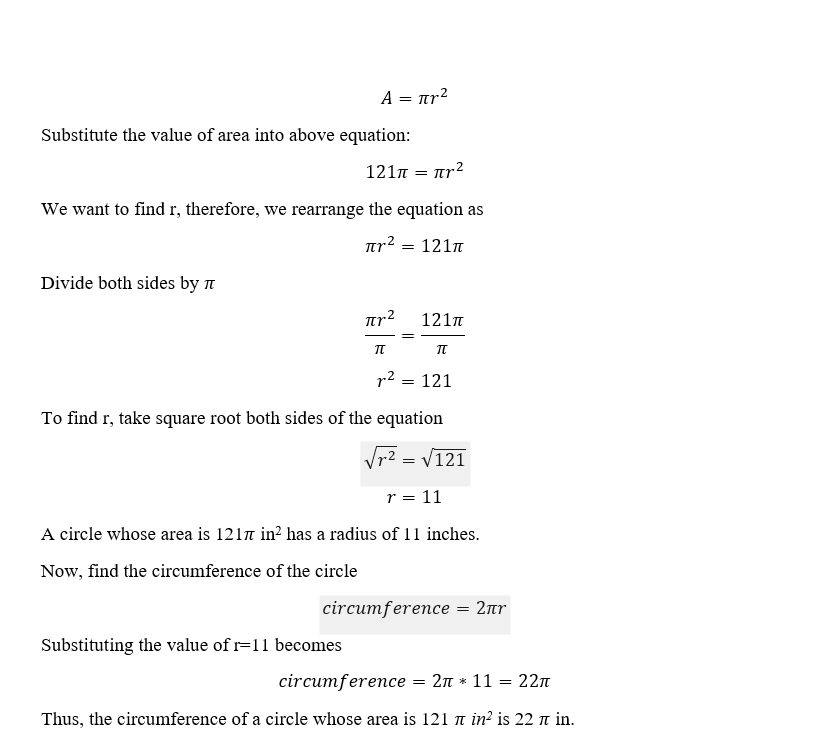
Correct Answer is B
Explanation
To solve this problem, first find the radius of the circle.
Correct Answer is D
Explanation
When solving percent problems, the following words and their meaning becomes handy.
- Is means equals
- Of means multiply
- What means unknown (variable)
If we let x represent the amount of tip the couple want to leave behind, then

So, the couple will leave a tip of $2.84, which is about $3.00
Correct Answer is D
Explanation
Looking at the give curve, we analyze each statement as:
- For statement 1: the points per game decreased five times between 1996 and 2015. So, the statement is false.
- For statement 2: the lowest points scored per game was in 1998-99 season and not in 2003-04 season. So, the statement is false.
- For statement 3: 2008-09 was the season the chargers scored the greatest number of points per game. So, this statement is false.
- For statement 4: the two season which no change in the points were 2012-13 and 2013-14. So this is true according to given curve.
Correct Answer is C
Explanation
The best way to visualize the student’s score for each subject is to plot them using a bar graph.
Correct Answer is A
Explanation
we are asked to find the largest value from the options given. To solve this problem, we need to convert all the given values into fraction. Then find the least common denominator for all fractions, which we will use to multiply each fraction and make a comparison.
43÷ 55=43/55
5/7
0.729=729/1000
73%=73/100
Now, we need to find the least common denominator of 55, 7, 1000, and 100, which is 77000. We multiply each fraction by 77000 as follows:
43/55*77000=60200
5/7*77000=55000
729/1000*77000=56133
73/100*77000=56210
From the calculated values, it can be noted that 43/55 is the greatest value among the given options.
Correct Answer is B
Explanation
We follow the order operations to solve for the unknown value of x.
3(2x+5)=11x+5
Open the bracket on the LHS by multiplying each term by 3
(3*2x)+(3*5)=11x+5
6x+15=11x+5
Subtract 15 from both sides
6x+15-15=11x+5-15
6x=11x-10
Subtract 11x on both sides
6x-11x=11x-11x-10
-5x=-10
Divide both sides by -5
-5x/-5=-10/-5
x= 2
Thus, the value of unknown value of x is 2.
Correct Answer is B
Explanation
Histograms are used to present frequency of data of one variable over the other. On the other hand, a bar graph is used to compare the two variables with the rectangles not touching one another as in histograms. Scatter plots are used to show the correlations between two variables. In this case, the teacher will be able to use scatter plot to establish the correlation between test scores and the subjects.
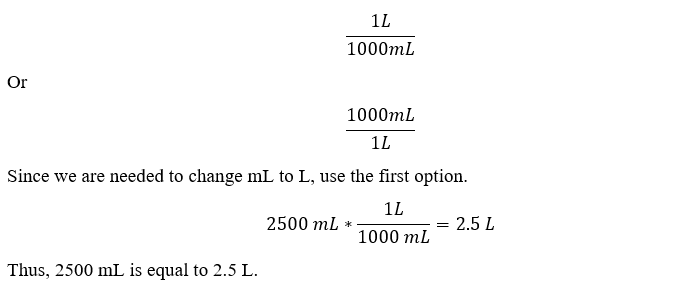
Correct Answer is C
Explanation
Explanation: We know that 1 L=1000 mL and to change between L and mL we use the following two options

Correct Answer is A
Explanation
: We need to find the total rainfall for the months of May, June, and July using the given graph.
In the month of May, rainfall is between 3 and 4, which is halfway. Therefore, rainfall in May is 3.5 inches
On June, rainfall was 3 inch and on July the rainfall was 2.5 inches. Thus,
Total rainfall=3.5 inches+3 inches+ 2.5 inches=9.0 inches
This question was extracted from the actual TEAS Exam. Ace your TEAS exam with the actual TEAS 7 questions, Start your journey with us today
Visit Naxlex, the Most Trusted TEAS TEST Platform With Guaranteed Pass of 90%.
Money back guarantee if you use our service and fail the actual exam. Option of personalised live tutor on your area of weakness.