A large pizza has a diameter of 16 inches. Which of the following is the area of the pizza in terms of pi (π)?
16 πin2
64 πin2
32πin2
256 πin2
Correct Answer : B
We are told to find the area of the pizza given its diameter. The pizza is in circular form, and its area is found as:

However, we are not given r, which is the radius of the circle. But we can find it from the given diameter as
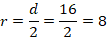
Substituting r=8 in the equation of the area of a circle
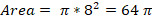
Thus, the area of the pizza is 64  in2.
in2.
NOTE:  (Pi) remains as a symbol because values of Pi can vary from 22/7 to 3.1415 to 3.14 and so forth.
TEAS 7 Exam Quiz Bank
HESI A2 Exam Quiz Bank
Find More Questions 📚
Teas 7 Questions: We got the latest updated TEAS 7 questions
100% Money Refund: 100% money back guarantee if you take our full
assessment pass with 80% and fail the actual exam.
Live Tutoring: Fully customized live tutoring lessons.
Guaranteed A Grade: All students who use our services pass with 90%
guarantee.
Related Questions
Correct Answer is B
Explanation
in the given problem, we use the calculator to find 1.3*0.47=0.611
Correct Answer is D
Explanation
The length of the unknown side of the rectangle can be found by using the Pythagoras theorem. We label the triangle from the given data as shown below
Let the unknown length be x.
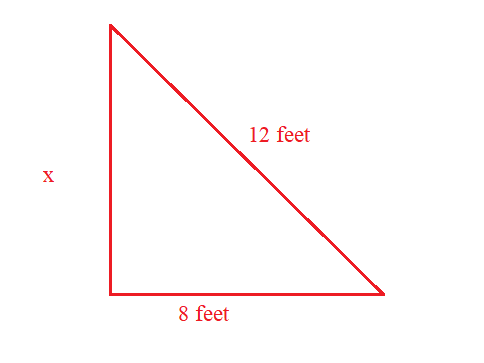
Applying the Pythagoras theorem, the value of x is found as:
\(a ^2 +b ^2 =c ^2\)
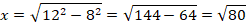

The unknown length of the triangle is approximately 8.9 feet.
Correct Answer is B
Explanation
When dealing with percent problems, the following is utilized to find the unknown variable.
- Is means equals
- Of means multiply
- What means unknown (variable)
From the problem above, we are looking for the amount of gratuity the couple can leave.
Let t be the amount of gratuity. Translating into an equation, we have
The gratuity is 15% of the total bill, which becomes
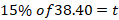
Here, of means multiply and we also convert percent into decimal before multiplying.
So, the value of t=5.76
Thus, a couple will leave a gratuity of $5.76, which is about $6.00.
Correct Answer is B
Explanation
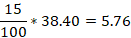
We need to find how many mL are in 2.5 teaspoons. We need to use dimensional analysis to solve this problem as follows.
Converting between teaspoon and mL uses the following conversions:

Or

We want to end up with mL, we utilize the second conversion and set up the following equation.
Thus, 2.5 teaspoons can hold 12.325 mL.
Correct Answer is C
Explanation
the median of a data set is the element that is found on the middle position. It is found by organizing the elements from the smallest to largest.
The data set above arranged from the smallest to largest is:
11, 12, 12, 12, 13, 14, 17, 17, 18, 22, 26
The number of elements is odd and the median is found in the (N+1)/2 th position. Here N=11, and the median falls in (11+1)/2=12/2=6 th position.
The element 14 falls in the 6th position, which is our median of the given data set.
Correct Answer is C
Explanation
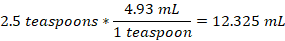
to find the average time the athlete runs in 1 mile, find total time divided by total distance covered.
Total distance=4+4=8 miles
Total time=28+32 =60 minutes
From the above, the athlete runs 8 miles in 60 minutes, so the athlete will take how minutes to cover 1 mile.
So, the athlete covers 1 mile in 7.5 minutes.
Correct Answer is D
Explanation
The best way to display the frequency of each day of the week when students get up after 8 a.m. is by using a bar graph. Bar graphs are well-suited for representing categorical data, where each day of the week is a separate category, and the height of each bar corresponds to the count or frequency of students waking up late on that specific day.
Note: Histograms, on the other hand, are more appropriate for visualizing continuous or numerical data and are not ideal for categorical data like days of the week.Histograms are useful for understanding the distribution of data, identifying patterns, and assessing the shape of the data distribution, such as whether it's normally distributed, skewed, or has multiple modes.
As you can see below, the Histogram is used to depict a pattern/continuous/rangedata. While a bar graph does just fine even with discrete data.


Correct Answer is C
Explanation
scatter plots can of three types: positive, negative and no correlation. A positive correlation scatter plot shows that as one variable increase, the other variable increases. A positive correlation can be visually depicted below.
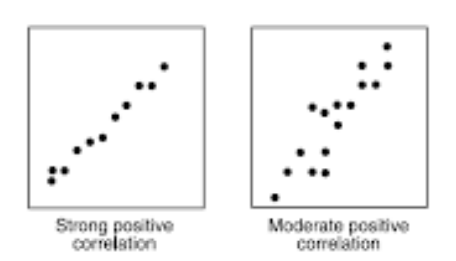
In a negative correlation, the change in one variable is inversely proportional to another variable. That is, as one variable increases, the other variable decreases as shown below.
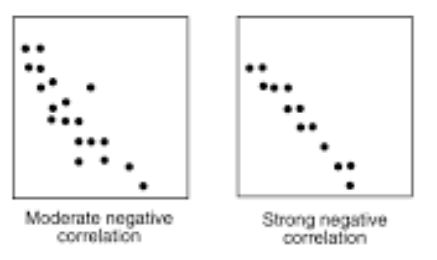
The third type of scatter plot is a no-correlation scatter plot. In this type of plot, there is no defined relationship between one variable and another one as in the curve below.
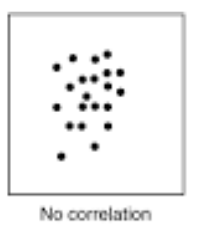
If we look at the relationship between the time the student listens to music and his test score, it is evident that no relationship exists between the two variables. Thus, this is a type of no correlation scatter plot.
Correct Answer is A
Explanation
we are needed to find the portion of pizza shared by 3 three friends. We treat the whole pizza as 1. Now, 1 friend eats half of the whole pizza. Thus,
One friend=1/2 of 1=1/2*1=1/2
Remaining amount=1-1/2=2/2-1/2=1/2
Thus, ½ of pizza is left for three friends to share among themselves. Then, each friend will get
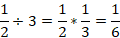
So, the other three friends will each get 1/6 of the pizza.
Correct Answer is C
Explanation
the question requires we find the cost of two syringes.
If we let x be the cost of two syringes, then we set up a proportion equation with cost as numerator and number of syringes as denominator. The proportion equation becomes

Cross-multiply to solve for x

Rearranging the above

Divide both sides by 35


The cost of 2 syringes is $32.
This question was extracted from the actual TEAS Exam. Ace your TEAS exam with the actual TEAS 7 questions, Start your journey with us today
Visit Naxlex, the Most Trusted TEAS TEST Platform With Guaranteed Pass of 90%.
Money back guarantee if you use our service and fail the actual exam. Option of personalised live tutor on your area of weakness.