A bucket can hold 3 L. How many ml can the bucket hold?
3000 mL
300 mL
30 mL
0.003 mL
Correct Answer : A
to change L to mL we use the following options of interconversions:

Or

Since we are needed to change L to mL, use the second option.
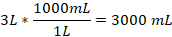
Thus, a bucket can hold 3000 mL which is equal to 3 L.
TEAS 7 Exam Quiz Bank
HESI A2 Exam Quiz Bank
Find More Questions 📚
Teas 7 Questions: We got the latest updated TEAS 7 questions
100% Money Refund: 100% money back guarantee if you take our full
assessment pass with 80% and fail the actual exam.
Live Tutoring: Fully customized live tutoring lessons.
Guaranteed A Grade: All students who use our services pass with 90%
guarantee.
Related Questions
Correct Answer is B
Explanation
in the given problem, we use the calculator to find 1.3*0.47=0.611
Correct Answer is D
Explanation
a ratio can be converted to a fraction of the form a/b, where b is not equal to zero. In ratio form, to means per.
From the given information, the class has 15 girls and 13 boys. Thus, the ratio of girls to boys becomes:

In ratio form, girls: boys=15:13
Thus, the ratio of girls to boys in a class of 28 students is 15 to 13.
Correct Answer is A
Explanation
We use 1 L =1000 mL to convert between the two units. The conversion fractions of interconverting are:

And

Since we want to end up with millimeters, the second conversion is used in converting L to mL as:
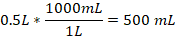
Thus, 0.5 L is equivalent to 500 mL.
Correct Answer is C
Explanation
we need to find the net income of the nurse in 4 weeks from the weekly net income.
Weekly net income=gross income-total tax
Total tax=federal income tax+state income tax+Social Security tax
Total tax=$(83.00+38.00+79.00)
Total tax=$200.00
Weekly net income=$(800.00-200.00)=$600.00
In one week, the net income of the nurse is $600.00 and in 4 weeks the nurse will a net income of:
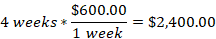
The nurse will earn $2,400.00 in 4 weeks after taxes are deducted.
Correct Answer is A
Explanation
We asked to convert kg to pounds. There are two ways of converting between kg and pounds

And

Since we are asked to find pounds, we use the second option for kg to cancel during conversion as follows:
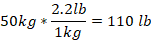
Thus, 50 kg is equal to 110 lb.
Correct Answer is C
Explanation
In this problem, we assume the truck carries a whole cargo. Thus, total weight is 516 lb divided by 1/3. Thus,

We change the division sign to product and multiply 516 by reciprocal of 1/3. Then,
The weight of the cargo will be 1548 lbs.
Correct Answer is A
Explanation
we are needed to find the amount Lana is left with after spending and investing the rest using the given information.
Amount Lana spends = 80% of $60= 80/100 *60 = $48
Amount left to invest = $(60-48) = $12
Lana is left with $12, which she invests and earns a profit of 80%.
Profit earned = 80% of $12 = 80/100 * 12= $9.20
So, Lana will have $12 + $9.20 = $21.60
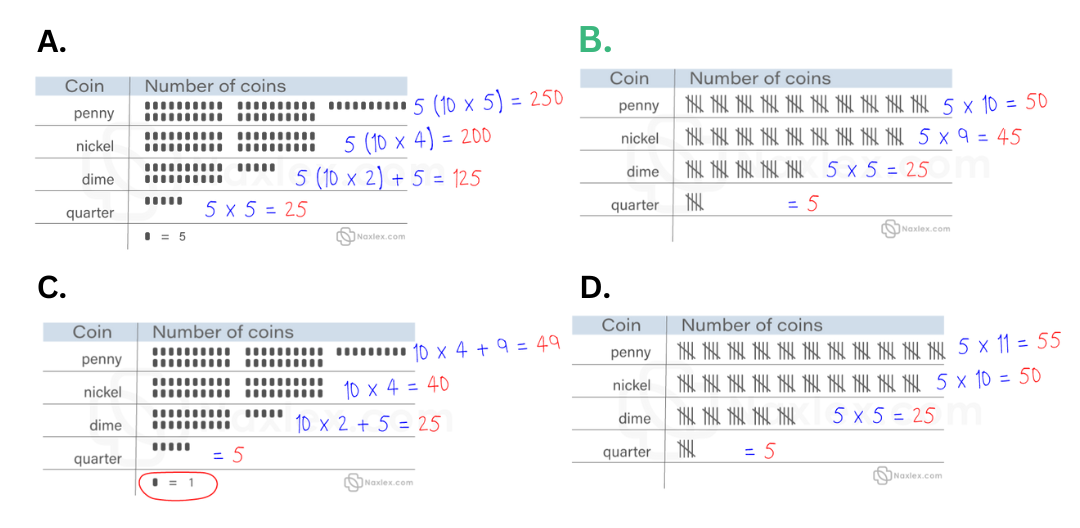
Correct Answer is B
Explanation
In this scenario, we use the given scale in the charts to find the number of each coin and selected the right number of coins the student collected. The second options shows that the child collected 50 pennies, 45 nickels, 25 dimes, and 5 quarters.
Correct Answer is C
Explanation
the median of a data set is the element that is found on the middle position. It is found by organizing the elements from the smallest to largest.
The data set above arranged from the smallest to largest is:
11, 12, 12, 12, 13, 14, 17, 17, 18, 22, 26
The number of elements is odd and the median is found in the (N+1)/2 th position. Here N=11, and the median falls in (11+1)/2=12/2=6 th position.
The element 14 falls in the 6th position, which is our median of the given data set.
Correct Answer is C
Explanation
we follow the order operations to solve for the unknown value of x.
2(4x+3)=7x+5
Open the bracket on the LHS by multiplying each term by 2
(2*4x)+(2*3)=7x+5
8x+6=7x+5
Subtract 6 from both sides
8x+6-6=7x+5-6
8x=7x-1
Subtract 7x on both sides
8x-7x=7x-7x-1
X=-1
Thus, the value of unknown value of x is -1.
This question was extracted from the actual TEAS Exam. Ace your TEAS exam with the actual TEAS 7 questions, Start your journey with us today
Visit Naxlex, the Most Trusted TEAS TEST Platform With Guaranteed Pass of 90%.
Money back guarantee if you use our service and fail the actual exam. Option of personalised live tutor on your area of weakness.